1
2
3
4
5
6
7
8
9
10
11
12
13
14
15
16
17
18
19
20
21
22
23
24
25
26
27
28
29
30
31
32
33
34
35
36
37
38
39
40
41
42
43
44
45
46
47
48
49
50
51
52
53
54
55
56
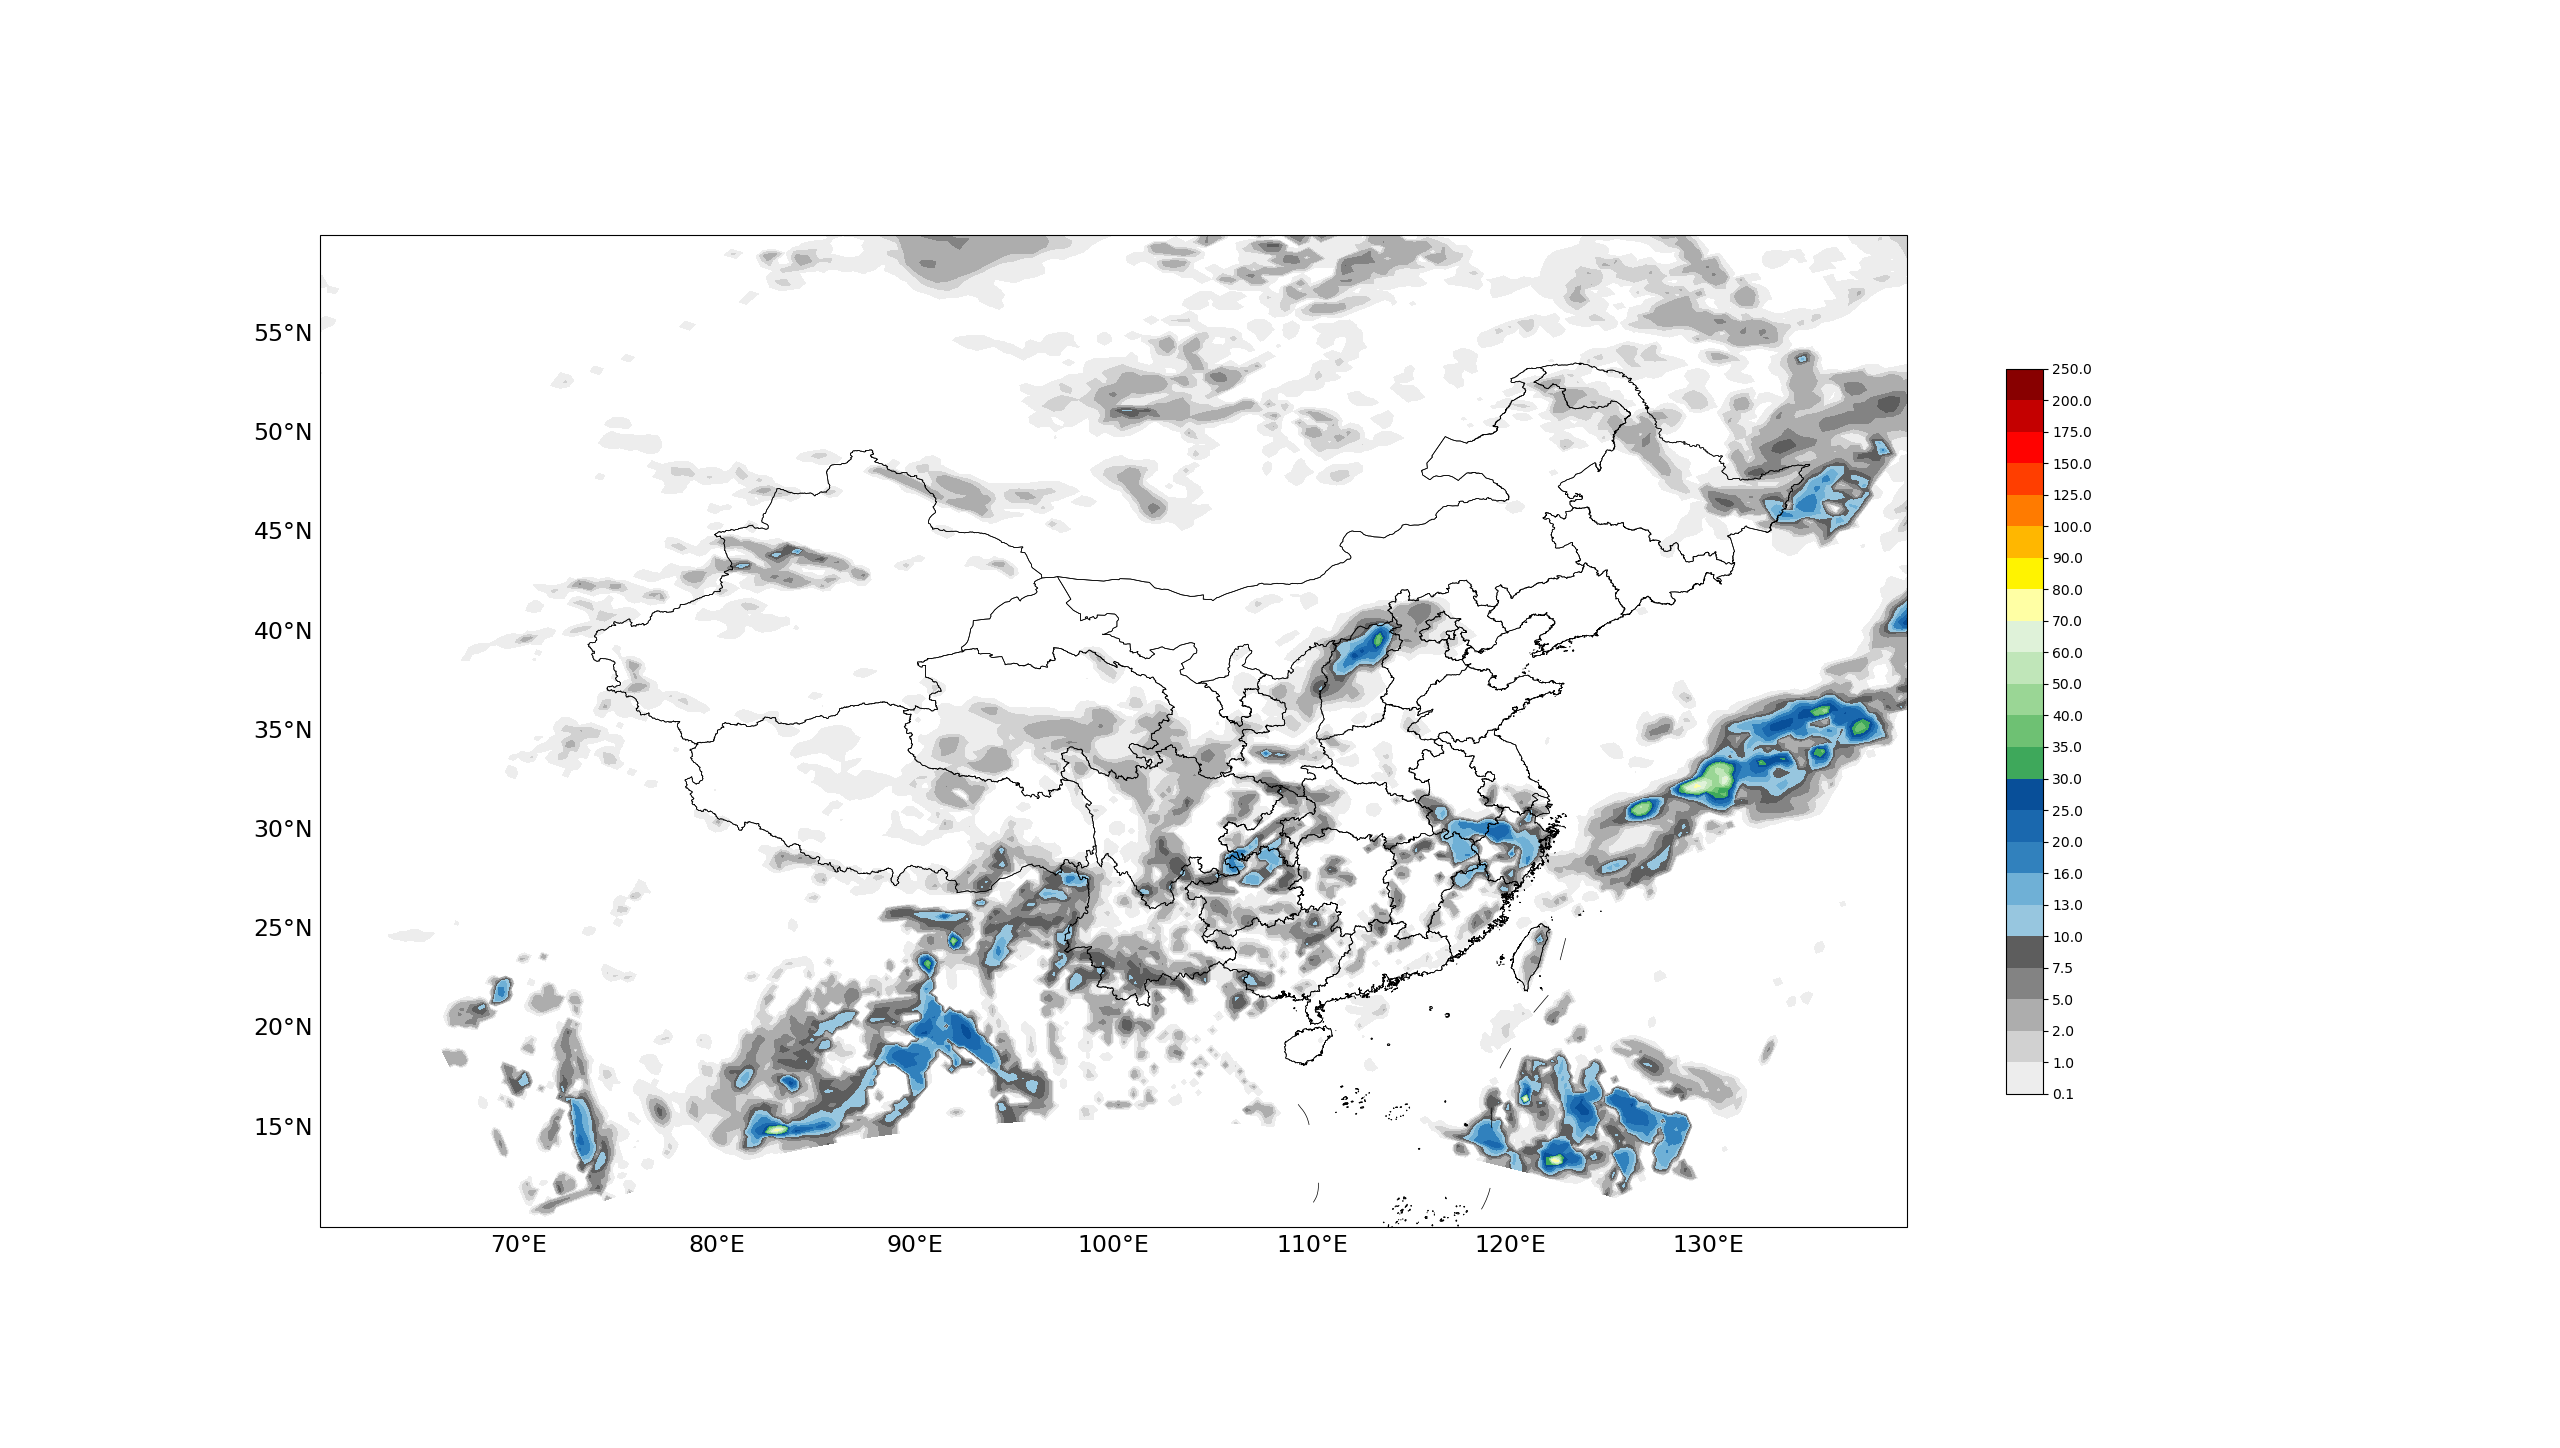
| import numpy as np
from netCDF4 import Dataset
from wrf import (getvar, to_np)
import matplotlib.pyplot as plt
import cartopy.crs as ccrs
from cartopy.mpl.gridliner import LONGITUDE_FORMATTER, LATITUDE_FORMATTER
from cartopy.io.shapereader import BasicReader
import matplotlib.ticker as mticker
f='E:\BaiduSyncdisk\Code\python\WRF\Data\wrfout_d01_2020-06-11_06_00_00'
ncfile = Dataset(f)
R = to_np(getvar(ncfile,"RAINC"))+to_np(getvar(ncfile,"RAINNC"))+to_np(getvar(ncfile,"RAINSH"))
lon = np.array(ncfile['XLONG'])[0,:,:]
lat = np.array(ncfile['XLAT'])[0,:,:]
countries=BasicReader(r'E:\BaiduSyncdisk\Code\Data\shape数据\国界\国家矢量.shp')
ten=BasicReader(r'E:\BaiduSyncdisk\Code\Data\shape数据\九段线\九段线.shp')
province=BasicReader(r'E:\BaiduSyncdisk\Code\Data\shape数据\2023年省级\2023年省级.shp')
rgb = ([237, 237, 237],[209, 209, 209],[173, 173, 173],[131, 131, 131],
[93 , 93 , 93],[151, 198, 223],[111, 176, 214],[49 , 129, 189],
[26 , 104, 174],[8 , 79 , 153],[62 , 168, 91],[110, 193, 115],
[154, 214, 149],[192, 230, 185],[223, 242, 217],[255, 255, 164],
[255, 243, 0],[255, 183, 0],[255, 123, 0],[255, 62 , 0],
[255, 2 , 0],[196, 0 , 0],[136, 0 , 0],
)
clors = np.array(rgb)/255.
clevs = [0.1, 1, 2, 5, 7.5, 10, 13, 16, 20, 25, 30, 35, 40, 50, 60,
70, 80, 90, 100, 125, 150, 175, 200, 250
]
fig = plt.figure(figsize=(10, 10))
ax = fig.add_subplot(111, projection=ccrs.PlateCarree())
contour = ax.contourf(lon,lat, R, clevs, colors=clors, transform=ccrs.PlateCarree())
cb_cf = fig.colorbar(contour, ax=ax,ticks=clevs, shrink=.65)
ax.add_geometries(countries.geometries(),linewidth=.5,edgecolor='black',crs=ccrs.PlateCarree(),facecolor='none')
ax.add_geometries(ten.geometries(),linewidth=.5,edgecolor='black',crs=ccrs.PlateCarree(),facecolor='none')
ax.add_geometries(province.geometries(),linewidth=.5,edgecolor='black',crs=ccrs.PlateCarree(),facecolor='none')
ax.set_extent([60,140,10,60],crs=ccrs.PlateCarree())
g1=ax.gridlines(draw_labels=True,linewidth=1,color='none',alpha=0.5,linestyle='--',x_inline=False,y_inline=False)
g1.top_labels=False
g1.right_labels=False
g1.xformatter=LONGITUDE_FORMATTER
g1.yformatter=LATITUDE_FORMATTER
g1.rotate_labels=False
g1.xlocator = mticker.FixedLocator(np.arange(60,140,10))
g1.ylocator = mticker.FixedLocator(np.arange(10,60,5))
g1.xlabel_style={'size':17}
g1.ylabel_style={'size':17}
|